
Assessing Your Financial Health: Top 22 Personal Financial Ratios
Table of Content
What Are Personal Financial Ratios?
Why Understanding Your Personal Financial Ratios Is Crucial
What’s in This Guide?
1. Capitalization Ratio
2. Cash Flow Ratio
3. Debt-to-Asset Ratio
4. Debt-to-Income Ratio
5. Debt-to-Net-Worth Ratio
6. Discretionary Income Ratio
7. Emergency Fund Ratio
8. Financial Independence Ratio
9. Housing Expense Ratio
10. Income Growth Rate
11. Income-to-Expense Ratio
12. Investment Ratio
13. Investment-to-Net-Worth Ratio
14. Liquidity Ratio
15. Net Worth Growth Ratio
16. Net Worth-to-Income Ratio
17. Rent-to-Income Ratio
18. Retirement Savings-to-Annual-Income Ratio
19. Retirement Savings-to-Net-Worth Ratio
20. Savings-to-Income Ratio
21. Savings-to-Net-Worth Ratio
22. Tax Burden Ratio
Financial Ratios: Essential Pieces but Not the Entire Financial Health Jigsaw
Financial Ratios: Trends Provide Better Insights
The Bottom Line
What Are Personal Financial Ratios?
Imagine you’re playing a game. In this game, the goal is to be as financially healthy as possible. To win, you have to manage your money well. You earn points by saving, investing, and spending wisely, and you lose points by having too much debt or spending too much. But how do you keep track of your points? How do you know if you’re winning or losing? That’s where personal financial ratios come in.
Personal financial ratios are like your scorecard in this game of financial stability. They help you understand how well you’re doing and where you might need to improve. They’re numbers that tell you important things about your financial health. You don’t need to be a math whiz to use them—they’re simple enough that anyone can understand and use them.
Think about it this way. Imagine you’re the coach of a football team. You’d want to know all sorts of stats about your team—how many goals they score, how many they let in, how often they keep possession, and so on. All these stats tell you something different about your team’s performance. They help you figure out what your team is doing well and where they need to practice more.
Personal financial ratios are the same. They’re your financial stats. They help you understand different aspects of your financial situation. Some ratios tell you how good you are at saving money, while others show you have too much debt. Looking at these ratios gives you a clear picture of your financial health.
Why Understanding Your Personal Financial Ratios Is Crucial
Think of your financial ratios as a GPS for your finances; it shows where you are financially and guides you towards your financial goals. Here are some of the top reasons why knowing how to calculate these ratios is helpful:
- Clear Understanding of Your Financial Health: Just as a health check-up provides insights into your physical well-being, financial ratios illuminate the state of your financial health. And just as a doctor’s visit can reveal potential health risks like high blood pressure, financial ratios can highlight pressing problems like growing debt or dwindling savings.
- Better Financial Decisions: Knowing your financial ratios helps you make decisions that align with your financial health and goals. Imagine if, after a health check-up, you found out you had high sugar levels. You’d likely cut down on sweets and increase your exercise. Similarly, noticing your savings ratio trend low over several periods can guide you to reduce non-essential spending to boost your savings.
- Goal-Oriented Planning: Your personal financial ratios serve as benchmarks, inspiring you to improve your financial habits. Just as a health check-up might lead you to set goals like losing weight or improving your diet, knowing your financial ratios can guide you in setting tangible financial goals. For example, suppose your financial ratios indicate you’re not saving enough. In that case, you can set a clear target to increase your savings by a certain percentage within a specified timeframe.
- Early Warning System: Regular health screenings can detect potential problems early on, like the onset of diabetes or high blood pressure. Similarly, financial ratios act as early warning systems, flagging potential issues before they escalate. Just as a rising cholesterol level might warn of future heart issues, an increasing debt ratio, for example, might indicate unsustainable spending habits.
- Peace of Mind: After a thorough health check-up, there’s a sense of relief and clarity, knowing that you’re either in good health or know what to address. Similarly, tracking your financial ratios provides a sense of security. It’s like getting a clean bill of health for your finances or at least knowing what areas need attention.
What’s in This Guide?
This guide will delve into 22 essential personal financial ratios, each addressing different facets of your financial health. For each ratio, we’ll provide its definition, formula, interpretation, benchmark, impact, and limitation. We’ll also include a practical tip, an example, and a summary.
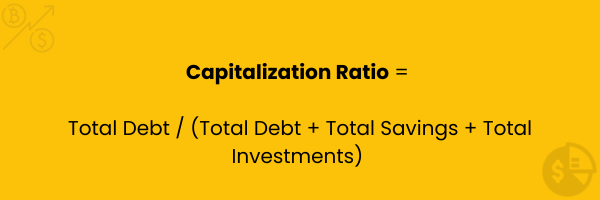
Definition: Capitalization Ratio, also known as financial leverage ratio, indicates the degree to which you rely on borrowed funds compared to your capital structure. Your capital structure comprises your equity (savings and investments) and total debt. Ideally, your savings and investments should be greater than your debt.
Formula: Capitalization Ratio = Total Debt / (Total Debt + Total Savings + Total Investments
Interpretation: A high Capitalization Ratio indicates a substantial reliance on debt, which is risky should your income decrease or interest rates increase, as both situations make it more difficult to service debt. Conversely, a low ratio means you’re less dependent on debt and represents a stable financial condition.
Benchmark: As a general rule of thumb, a Capitalization Ratio below 0.30 is healthy, although the lower, the better.
Example: If you have $10,000 in debt, $20,000 in savings, and $70,000 in investments, your Capitalization Ratio will be $10,000 / ($10,000 + $20,000 + $70,000) = 0.1. In this scenario, you have a healthy Capitalization Ratio. You could still take on some more debt to finance an asset purchase.
Key Impact: A high Capitalization Ratio might make lenders hesitant to approve your loan applications or extend credit due to an increased risk of default. On the other hand, a low ratio can improve your creditworthiness, making it easier for you to secure loans or mortgages.
Key Limitation: Capitalization Ratio offers a clear picture of your reliance on debt, providing essential insights for your financial planning. Still, it doesn’t consider cash flow or earning capacity, which means it may overlook other crucial aspects of your financial stability.
Pro Tip: If you wish to lower your Capitalization Ratio, consider reducing unnecessary debt, increasing your savings, and improving your investment returns. Consulting with a financial professional can provide personalized strategies tailored to your situation.
TLDR: Your Capitalization Ratio highlights your level of dependence on debt. A low ratio means you’re less reliant on borrowed money, suggesting a healthier financial condition and the capacity to take on more debt.
2. Cash Flow Ratio
Definition: Cash Flow Ratio measures the proportion of your net (after-tax) monthly income used to cover monthly expenses, reflecting your ability to handle these financial obligations.
Formula: Cash Flow Ratio = Monthly Expenses / Monthly Net Income

Interpretation: A high ratio indicates you are spending an excessive amount of your income on expenses, which means less money for savings and investments and may lead to financial strain. In contrast, a low ratio suggests you are spending a sustainable proportion of your income on expenses, which means more money for savings and investments.
Benchmark: Aim for a Cash Flow Ratio that’s not more than 0.50—the lower, the better. Having a Cash Flow Ratio consistently near or above 0.50 might indicate a need to reassess your spending habits and financial prioritie
Example: If your monthly after-tax income is $4,000, and your monthly debt payments add up to $1,750, your Cash Flow Ratio would be $1,750 / $4,000 = 0.44. Your expenses are manageable in this scenario, but you should monitor them closely to ensure they don’t exceed the sustainable level of 0.50.
Key Impact: Cash Flow Ratio is essential for budgeting and financial planning. It enables you to evaluate your spending habits and allocate your income wisely. A low cash flow ratio allows more freedom to save and invest, facilitating the achievement of long-term financial goals and stabilit
Key Limitation: Large unforeseen expenses, such as emergency medical costs, or unexpected income loss, such as job redundancy, significantly impact the Cash Flow Ratio. Therefore, observing the ratio over several periods, such as 12 months, provides a more accurate picture of your financial management ability rather than relying on a single period’s data.
Pro Tip: Regularly calculate and monitor your Cash Flow Ratio. Doing so helps you understand how your expenses affect your income, which could encourage more disciplined spending. Additionally, planning for contingencies, such as having an emergency fund equivalent to 3-6 months of expenses, can cushion against unexpected challenges that might otherwise disrupt your Cash Flow Ratio.
TLDR: Cash Flow Ratio is a critical tool that measures how much of your income goes into covering expenses. Aim to keep it below 0.5 for financial stability.
3. Debt-to-Asset Ratio
Definition: Debt-to-Asset Ratio measures the percentage of your assets financed by debt, providing insight into your financial leverage and creditworthiness. Financial institutions often use this metric to make informed decisions about credit extensions.
Formula: Debt-to-Asset Ratio = Total Debt / Total Assets

Interpretation: A high Debt-to-Asset Ratio implies over-leveraging (excessive borrowing), which may make it challenging to meet your financial obligations, especially if your income fluctuates. Conversely, a low Debt-to-Asset Ratio denotes a lower financial risk, indicating you bought more of your assets through personal funds rather than debt.
Benchmark: Aiming for a Debt-to-Asset Ratio of less than 0.50 is generally considered sound financial practice. Anything above this mark may warrant a review of your debt management strategy.
Example: For instance, if your total assets and total debts are $200,000 and $80,000, respectively, your Debt-to-Asset Ratio will be calculated as $80,000 / $200,000 = 0.4. In this scenario, your debt is within manageable limits, and you can take on additional debt to finance an asset if needed.
Key Impact: A high Debt-to-Asset Ratio could make access to additional credit difficult, as lenders may view you as a high-risk candidate due to increased debt burden. A low ratio, on the other hand, boosts your creditworthiness and chances of securing loans on favorable terms.
Key Limitation: While valuable in evaluating financial risk, the Debt-to-Asset Ratio overlooks factors like cash flow and income, which are crucial in assessing your ability to pay off debt. Hence, it provides only a partial perspective of your overall financial risk.
Pro Tip: You can improve your Debt-to-Asset Ratio by paying debts as early as possible (especially those with high interest), accumulating more assets, and trimming expenses.
TLDR: Debt-to-Asset Ratio is a crucial gauge of financial stability, showing how much of your assets are financed by debt. A low ratio suggests better financial stability and less credit risk, indicating sound financial health.
4. Debt-to-Income Ratio
Definition: Debt-to-Income Ratio represents the portion of your gross income dedicated to servicing debt obligations. It guides borrowing decisions, and lenders often use it to assess your ability to handle additional debt responsibly.
Formula: Debt-to-Income Ratio = Total Monthly Debt Payments / Monthly Gross Income

Interpretation: Having a high Debt-to-Income Ratio implies a large part of your income goes towards repaying debt, limiting your ability to save, invest, or handle unforeseen expenses. It also means you can’t take on more debt and may have to adjust your existing debt structure. Conversely, a low Debt-to-Income Ratio signifies a solid capacity to manage existing debt and potentially take on more, particularly if financing an asset.
Benchmark: Lenders typically regard a Debt-to-Income Ratio of 0.36 or less as positive, interpreting it as a sign of controllable debt levels. However, certain lenders, like those in the mortgage sector, may prefer a much lower Debt-to-Income Ratio.
Example: If you have a monthly gross income of $6,000 and your total monthly debt payments amount to $2,000, your Debt-to-Income Ratio would be $2,000 / $6,000 = 0.33. This ratio suggests a healthy balance between your debt and income, as it falls within the commonly acceptable range.
Key Impact: A high Debt-to-Income Ratio might limit your access to new credit or lead to higher interest rates due to the implied risk. In contrast, maintaining a lower Debt-to-Income Ratio can boost your creditworthiness, leading to better credit terms.
Key Limitation: Debt-to-Income Ratio provides a clear snapshot of your debt burden relative to your income. However, it overlooks other significant expenses, such as living costs and savings contributions. Therefore, it may not fully reflect the full weight of your financial obligations on your income.
Pro Tip: To improve your Debt-to-Income Ratio, consider implementing tactics that boost your income or minimize your debt. These tactics could involve seeking a higher-paying job, undertaking part-time work, expediting debt repayment, or cutting discretionary spending to channel more funds toward debt reduction.
TLDR: Debt-to-Income Ratio shows the portion of your gross income spent on debt payments. A low ratio is typically better, suggesting a healthier financial standing and manageable debt levels.
5. Debt-to-Net-Worth Ratio
Definition: Debt-to-Net-Worth Ratio measures financial leverage and risk, revealing how much of your net worth consists of debt. It’s a key indicator of your financial stability and resilience to potential financial shocks.
Formula: Debt-to-Net-Worth Ratio = Total Debt / Net Worth

Interpretation: A high Debt-to-Net-Worth Ratio means that debt makes up a considerable chunk of your net worth, which can be risky if your income is disrupted or unexpected expenses crop up. Conversely, a low ratio demonstrates financial strength, which, in turn, implies lower financial risk.
Benchmark: An ideal Debt-to-Net-Worth Ratio varies based on individual factors such as age, income, and financial objectives. However, maintaining the ratio below 0.50 is advisable, as anything above that indicates increased financial risk.
Example: If you had a net worth of $200,000 and a total debt of $50,000, your Debt-to-Net-Worth Ratio would be $50,000 / $200,000 = 0.25. In this scenario, your financial leverage and risk are low, giving you more protection against income disruption.
Key Impact: A high Debt-to-Net-Worth Ratio can affect your credit ratings, restricting your ability to secure new loans or credit lines. A low ratio, on the other hand, boosts your perceived creditworthiness, making it easier to access favorable borrowing terms.
Key Limitation: Debt-to-Net-Worth Ratio, while helpful in assessing financial risk, fails to account for influential factors like available cash and income. These factors are central to understanding how effectively you can manage and repay your debts.
Pro Tip: To improve your Debt-to-Net-Worth Ratio, implement strategies that help reduce your debts and increase your net worth. Such strategies include boosting savings through a high-yield savings account, paying off high-interest debts first, or cutting back on unnecessary borrowing, such as avoiding credit card balances.
TLDR: Debt-to-Net-Worth Ratio provides a snapshot of your financial leverage by contrasting your total debt with your net worth. Striving for a low ratio is wise, as it reflects robust financial health and reduced risk.
6. Discretionary Income Ratio
Definition: Discretionary Income Ratio indicates the percentage of your income available for savings, investments, and non-essential spending after paying your essential expenses.
Formula: Discretionary Income Ratio = (Monthly Gross Income — Monthly Essential Expenses) / Monthly Gross Income

Interpretation: A high Discretionary Income Ratio means a significant portion of your income is available for discretionary spending, indicating greater financial flexibility. In contrast, a low ratio implies that essential expenses and taxes take up most of your income, limiting your financial wiggle room.
Benchmark: The ideal ratio varies based on lifestyle, goals, and risk appetite, but as a rule of thumb, a Discretionary Income Ratio of 0.50 or higher is favorable.
Example: Assuming your monthly gross income and essential expenses are $5,000 and $3,500, respectively, your Discretionary Income ratio will be ($5,000 – $3,500) / $5,000 = 0.3. In this scenario, 30% of your gross income is available for saving, investing, or spending on non-essential items.
Key Impact: Knowing your Discretionary Income Ratio helps you plan your finances better. A high ratio means you’re in a solid position to increase your savings or investments, contributing to long-term financial security. Moreover, lenders often regard a high ratio positively when assessing creditworthiness.
Key Limitation: Discretionary Income Ratio does not account for unexpected or irregular expenses, which can significantly impact your financial flexibility. Additionally, the ratio doesn’t consider the cost-of-living differences across various geographical locations. For example, the same income may offer different discretionary spending levels in a metropolitan city compared to a rural area.
Pro Tip: Regularly calculate and monitor your Discretionary Income Ratio to gain valuable insight into your financial situation. If your ratio is low, consider reassessing your budget to identify areas where you can reduce spending or increase income. Conversely, if your ratio is high, evaluate whether you could invest or save more effectively to maximize your financial growth.
TLDR: Discretionary Income Ratio reveals the portion of your income available for non-essential expenses. While the ratio doesn’t adjust for unexpected costs or regional cost-of-living, it’s a helpful tool for financial planning.
7. Emergency Fund Ratio
Definition: Emergency Fund Ratio measures how long you can support your essential living expenses with your current emergency savings.
Formula: Emergency Fund Ratio = Total Emergency Fund / Monthly Essential Expenses

Interpretation: Emergency Fund Ratio represents how many months you could cover your essential expenses with your current emergency savings. Therefore, the higher the ratio, the longer you can sustain your essential expenses without income, and vice versa.
Benchmark: There is no hard and fast rule, but generally, having an Emergency Fund Ratio between 3 and 6 provides a good buffer for short-term financial hiccups.
Example: If you have $15,000 in your emergency fund and your monthly essential expenses amount to $3,000, your Emergency Fund Ratio would be $15,000 / $3,000 = 5. In this scenario, you can cover five months of your essential expenses if you lose your income.
Key Impact: Knowing your Emergency Fund Ratio can guide your saving strategy and help you plan your finances better. A high ratio can provide peace of mind and financial stability during unforeseen circumstances, such as job loss, medical emergencies, or unexpected large expenses. It buys you time to find solutions without taking on debt or sacrificing essential needs.
Key Limitation: While the Emergency Fund Ratio is a good indicator of short-term financial resilience, it overlooks aspects of long-term security such as retirement funds, investments, or income growth prospects.
Pro Tip: Contribute regularly to your emergency fund. Start with a small, manageable amount and increase it as your income grows. Also, adjust your ratio target periodically according to your personal risk factors, such as job security, health conditions, or number of dependents. For instance, an addition to the family may warrant a higher targeted ratio.
TLDR: Emergency Fund Ratio evaluates the robustness of your financial buffer in terms of covering necessary costs with emergency savings. A key indicator of financial security and resilience, it’s crucial to maintain, review, and fine-tune this ratio to cater to evolving circumstances.
8. Financial Independence Ratio
Definition: Financial Independence Ratio measures how close you are to achieving financial independence. In this case, financial independence means the point at which your passive income can sustain your living expenses without the need for active employment.
Formula: Financial Independence Ratio = Monthly Passive Income / Monthly Expenses

Interpretation: A high Financial Independence Ratio signifies that your passive income, such as returns from investments, rental income, royalties, etc., covers a considerable portion of your living expenses, edging you closer to financial freedom.
Benchmark: While the goal is to have a Financial Independence Ratio of 1 or higher, reaching that milestone takes time. Starting with smaller targets and incrementally increasing them is a more practical approach. A ratio of 0.1, for example, indicates that your passive income covers 10% of your monthly living expenses, which is a good starting point.
Example: If you have a monthly passive income of $5,000 and your monthly living expenses amount to $6,000, your Financial Independence Ratio would be $5,000 / $6,000 = 0.83. Your passive income covers 83% of your monthly living expenses in this scenario.
Key Impact: Financial Independence Ratio offers insight into your progress toward financial independence. It helps you assess the effectiveness of your investment strategies in generating adequate passive income. Moreover, it can guide your financial decisions, prompting you to increase your passive income streams or manage your expenses more effectively. Achieving a high ratio could open doors to early retirement or the pursuit of passion projects instead of being bound to income-driven employment.
Key Limitation: A notable limitation of this ratio is its lack of consideration for the potential volatility of passive income sources and the evolving nature of living expenses. For instance, passive incomes like stock dividends do fluctuate, and living expenses often increase with inflation or lifestyle shifts. So, while the ratio captures your current standing, it may not always provide an accurate forecast for sustaining financial independence in the future.
Pro Tip: To improve your Financial Independence Ratio, focus on boosting your passive income through intelligent investments, diversifying your income streams, and controlling and managing your living expenses efficiently.
TLDR: Financial Independence Ratio indicates how well your passive income covers your living expenses. A high ratio suggests you’re closer to a state where you can live off your passive income without relying on active employment. Regularly reviewing this ratio can help steer financial planning and investment decisions.
9. Housing Expense Ratio
Definition: Housing Expense Ratio measures the proportion of your monthly or yearly income dedicated to housing costs. Lenders often use the ratio to evaluate your ability to manage your housing costs effectively and meet mortgage payments.
Formula: Housing Expense Ratio = Monthly Housing Expenses / Monthly Gross Income

Interpretation: A high Housing Expense Ratio indicates a significant portion of your income is spent on housing, suggesting a higher financial burden and less income available for other expenses or savings. Conversely, a lower ratio means you are spending less of your income on housing, suggesting more financial flexibility.
Benchmark: Most lenders recommend a Housing Expense Ratio of no more than 0.28 as a guideline for affordable housing costs.
Example: If your monthly housing expenses are $1,200 and your gross income is $4,000, your Housing Expense Ratio would be $1,200 / $4,000 = 0.30 or 30%. In this scenario, securing a mortgage might prove challenging unless you have a history of excellent credit.
Key Impact: Your Housing Expense Ratio can significantly influence your financial health. A high ratio may limit your ability to handle unexpected expenses, save, or invest. It’s also a crucial factor in mortgage approval decisions, impacting your ability to purchase a home.
Key Limitation: While the Housing Expense Ratio is a useful measure of how you’re managing your housing expenses, it doesn’t consider other debt obligations or living expenses you may have. Therefore, a low ratio doesn’t always portray financial stability.
Pro Tip: To lower your Housing Expense Ratio, consider strategies like increasing your income, paying off a portion of your mortgage to lower payments, refinancing for a lower interest rate, or downsizing to a less expensive home.
TLDR: Housing Expense Ratio assesses how your monthly or yearly housing costs stack up against your gross income. Lenders typically look for a ratio of 0.28 or less for mortgage approvals. A lower ratio indicates excellent expense management and can help you qualify for better mortgage rates.
10. Income Growth Rate
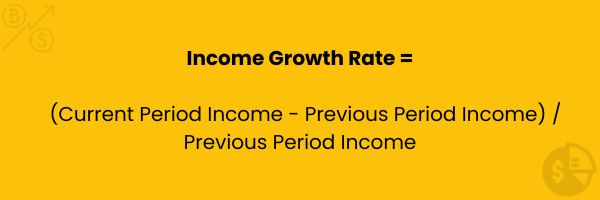
Definition: Income Growth Rate indicates how much your income has increased over a certain period. It’s a helpful indicator of your financial progression and how quickly you grow your earnings.
Formula: Income Growth Rate = (Current Period Income – Previous Period Income) / Previous Period Income
Interpretation: A high Income Growth Rate signifies that your income is growing at a fast pace, which may indicate career progression, successful investments, or additional income sources. Conversely, a low or negative growth rate suggests your income is stagnating or decreasing, which could indicate career stagnation, job loss, or underperforming investments.
Benchmark: There’s no universally accepted benchmark for the Income Growth Rate, as it can vary widely depending on age, industry, and income sources. However, aiming for a growth rate that at least keeps pace with inflation ensures the real value of your income doesn’t diminish.
Example: If your income last year was $50,000 and this year it’s $55,000, your Income Growth Rate would be: ($55,000 – $50,000) / $50,000 = 0.1 or 10%. Assuming inflation is 5% during this time, this suggests you’ve grown your income twice as fast as average prices have risen.
Key Impact: Tracking your Income Growth Rate can help you understand how effectively you increase your earning potential over time. It can inform career decisions, investment strategies, and retirement planning. A steadily rising rate can lead to improved financial security, increased saving potential, and a better standard of living.
Key Limitation: Income Growth Rate doesn’t reflect income stability. For example, one-off events like a windfall or bonus can inflate the rate, but this doesn’t necessarily mean your income will consistently grow at that rate.
Pro Tip: To boost your Income Growth Rate, consider investing in yourself by furthering your education, enhancing your skills, or seeking career advancement opportunities. Additionally, diversifying your income streams, particularly with passive income sources, is a strategic way to ensure steady growth.
TLDR: Income Growth Rate reveals how your income changes over time. While the ratio is a valuable measure of your earnings growth, it’s crucial to discern between consistent growth and one-off income spikes.
11. Income-to-Expense Ratio
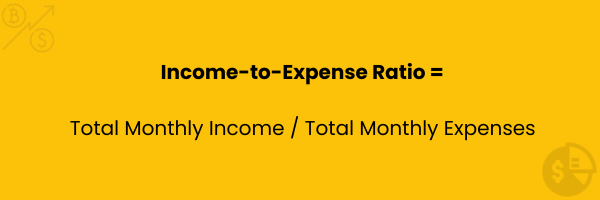
Definition: Income-to-Expense Ratio measures how your total income stacks against your total expenses, indicating your financial sustainability.
Formula: Income-to-Expense Ratio = Total Monthly Income / Total Monthly Expenses
Interpretation: A high Income-to-Expense Ratio indicates that your income sufficiently covers your expenses, leaving a surplus for savings or investments. On the other hand, a low ratio means that your expenses exceed your income, suggesting financial strain and potential debt accumulation.
Benchmark: Ideally, your Income-to-Expense Ratio should be greater than 1, indicating that you have surplus income after meeting your expenses. Most financial planners consider a ratio of 1.5 or higher healthy, as it implies a significant surplus that you can channel into savings, investments, or debt payments.
Example: If your total monthly income is $5,000 and your total monthly expenses are $4,000, your Income-to-Expense Ratio would be $5,000 / $4,000 = 1.25.
Key Impact: Maintaining a high Income-to-Expense Ratio ensures you’re living within your means and have room for savings, investments, and emergency funds. It cushions against financial setbacks and can contribute to financial stability and independence.
Key Limitation: Income-to-Expense Ratio does not consider the nature, quality, or purpose of your expenses, nor the stability or source of your income. For instance, high expenses might be due to necessary investments or short-term occurrences, and they might not necessarily suggest financial imprudence.
Pro Tip: To improve your Income-to-Expense Ratio, consider ways to increase your income by seeking a raise or creating additional income streams or decrease your expenses by budgeting, cutting discretionary spending, or reducing debt.
TLDR: Income-to-Expense Ratio compares your total income to your total expenses, helping to indicate if you’re living within your means. A ratio greater than one is preferred, suggesting you earn more than you spend. Boosting your income or reducing expenses can improve this ratio.
12. Investment Ratio
Definition: Investment Ratio quantifies the portion of your monthly income that you invest in assets like stocks, bonds, real estate, etc. It provides insight into how proactive you are about growing your wealth and preparing for long-term financial goals.
Formula: Investment Ratio = Total Monthly Investment / Monthly Gross Income

Interpretation: A high Investment Ratio signifies that you are dedicating a larger portion of your income towards investments, indicating a proactive approach towards wealth accumulation. Conversely, a low ratio could suggest that less of your income is available for investments or a more conservative approach, possibly due to market volatility concerns, personal financial commitments, or a preference for liquidity.
Benchmark: While the ideal Investment Ratio can vary depending on individual financial goals, risk tolerance, and age, financial advisors often recommend a ratio of 0.15-0.20. A ratio significantly above this may indicate potential overexposure to market risks, while a much lower ratio might mean missed opportunities for wealth growth.
Example: If your total monthly investments are $1,000 and your monthly gross income is $5,000, your Investment Ratio is $1,000 / $5,000 = 0.2.
Key Impact: Maintaining a high Investment Ratio can contribute significantly to wealth accumulation, financial security, and achievement of long-term financial goals such as retirement. It encourages disciplined investing, which can lead to substantial growth due to the power of compounding. That said, a high Investment Ratio could mean less income for immediate expenses and desired lifestyle.
Key Limitation: Investment Ratio doesn’t reflect your investments’ effectiveness or performance. Therefore, while a high ratio implies a proactive investing strategy, it does not guarantee high returns, especially if your investments aren’t well-chosen. Also, the ratio doesn’t account for debt levels, emergency fund adequacy, or other financial commitments, all of which you must consider when determining how high your Investment Ratio should be.
Pro Tip: To improve your Investment Ratio, consider automating your investments to ensure consistency. Also, regularly review your financial plan and investment portfolio to adjust the ratio based on your evolving financial situation and goals.
TLDR: Investment Ratio measures what portion of your income you invest, reflecting your approach to wealth accumulation. A high ratio can enhance wealth growth and long-term financial stability. Still, balancing this against your immediate financial needs and responsibilities is essential.
13. Investment-to-Net-Worth Ratio
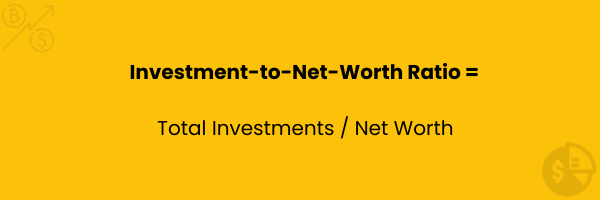
Definition: Investment-to-Net-Worth Ratio compares your total investments to your overall net worth. This ratio offers insight into how much of your wealth is actively working to grow further.
Formula: Investment-to-Net-Worth Ratio = Total Investments / Net Worth
Interpretation: A high Investment-to-Net-Worth Ratio shows a substantial portion of your wealth is dedicated to investments, suggesting a proactive or aggressive wealth accumulation strategy. Conversely, a low ratio means that you’ve invested a smaller part of your wealth, which might indicate a conservative financial strategy or that you have a significant portion of your wealth tied up in non-investment assets like property or cash.
Benchmark: This ratio has no fixed ideal standard; it can vary greatly depending on age, risk tolerance, financial goals, and lifestyle choices. A younger individual might have a higher ratio, while someone nearing retirement might have a lower ratio. Consult a financial advisor to determine an appropriate ratio for your unique circumstances.
Example: If your total investments are worth $200,000 and your net worth is $500,000, your Investment-to-Net-Worth Ratio would be $200,000 / $500,000 = 0.4. In this scenario, you’ve invested 40% of your net worth, which means a substantial amount of your net worth is actively working to grow your wealth further.
Key Impact: A high Investment-to-Net-Worth Ratio, aligned with individual risk tolerance and goals, can accelerate wealth growth over time, strengthening financial security and paving the way for an early or more comfortable retirement. It also indicates active wealth management and the potential for higher returns.
Key Limitation: Investment-to-Net-Worth Ratio doesn’t account for your investments’ risk level or performance. Additionally, it overlooks individual liquidity needs or reasons for holding wealth in more liquid, non-invested forms.
Pro Tip: Continuously reviewing and tailoring your investment portfolio to match your evolving risk tolerance and financial goals will help optimize your Investment-to-Net-Worth Ratio.
TLDR: Investment-to-Net-Worth Ratio measures the proportion of your net worth tied up in investments. While a high ratio might signal an aggressive approach to wealth growth, the ideal ratio is personal and depends on your financial goals and risk appetite.
14. Liquidity Ratio
Definition: Liquidity Ratio evaluates your capacity to meet short-term financial obligations using assets that can be quickly converted to cash, such as savings or checking accounts. It’s a barometer for your short-term financial health.
Formula: Liquidity Ratio = Liquid Assets / Total Monthly Expenses

Interpretation: A high Liquidity Ratio suggests that you have ample liquid assets to cover your expenses, indicating higher financial security in case of unexpected events like a job loss or medical emergency. On the flip side, a low Liquidity Ratio may indicate a higher risk of financial strain in the event of unforeseen expenses or income loss.
Benchmark: Ideally, this ratio should reflect enough liquid assets to cover 3 to 6 months of expenses—a commonly advised threshold for emergency funds. Still, individual circumstances might influence the best benchmark.
Example: If your total liquid assets amount to $30,000 and your total short-term obligations are $7,500, your Liquidity Ratio would be $30,000 / $7,500 = 4. In this scenario, you can cover your financial obligations for the next four months without income.
Key Impact: Maintaining a healthy Liquidity Ratio provides financial security, ensuring you can meet your short-term financial obligations without incurring debt or selling long-term assets.
Key Limitation: While the Liquidity Ratio is a good measure of short-term financial health, it does not consider long-term financial stability or assets you cannot quickly convert to cash. Moreover, having a high ratio could indicate an overly conservative approach, suggesting you’re not optimally using your excess liquid assets to create wealth.
Pro Tip: To improve your Liquidity Ratio, consider implementing strategies such as reducing unnecessary expenses to decrease liabilities or saving and investing wisely to increase liquid assets. However, balance is crucial to ensure you’re also allocating resources toward long-term financial goals.
TLDR: Liquidity Ratio gauges your short-term financial security, with high values indicating a solid buffer against unforeseen expenses.
15. Net Worth Growth Ratio
Definition: Net Worth Growth Ratio reveals the percentage change in your net worth over a specified period. Net worth refers to the total assets minus total liabilities a person possesses. This ratio is a crucial indicator of your financial progress and the effectiveness of your wealth accumulation strategy.
Formula: Net Worth Growth Ratio = (Current Net Worth – Previous Net Worth) / Previous Net Worth

Interpretation: A positive Net Worth Growth Ratio indicates that your wealth is increasing, signifying effective saving and investing strategies. On the other hand, a negative growth rate suggests that your wealth is decreasing, possibly due to increased debt, reduced asset values, or poor investment performance.
Benchmark: Net Growth Ratio has no standard benchmark, as various factors, including income, age, financial goals, and market conditions, can significantly influence it. Still, it would be best if you aimed for a positive ratio that matches or outpaces the current inflation rate to ensure the real value of your wealth doesn’t diminish.
Example: If your net worth last year was $100,000 and this year it’s $110,000, your Net Worth Growth Ratio is ($110,000 – $100,000) / $100,000 = 0.1 or 10%. Assuming inflation is 5.5% during this period, this means your wealth has increased faster than average prices.
Key Impact: Net Worth Growth Ratio provides insight into how effectively you’re growing your wealth. It can motivate you to save more, invest wisely, and manage debts, ultimately leading to financial stability and progress toward your long-term financial goals.
Key Limitation: External factors, such as market fluctuations, can substantially influence your Net Worth Growth Ratio. Additionally, this ratio doesn’t account for the quality of growth, whether due to asset appreciation, debt reduction, or increased savings, which can have different implications for your financial health.
Pro Tip: To improve your Net Worth Growth Ratio, consider implementing strategies like minimizing debts, reducing expenses, increasing savings, and making smart investments.
TLDR: Net Worth Growth Ratio tracks the evolution of your financial health.
A positive ratio indicates successful wealth accumulation, while a negative ratio could suggest financial setbacks. There’s no universal benchmark, but a positive growth ratio is generally desirable.
16. Net Worth-to-Income Ratio
Definition: Net Worth-to-Income Ratio compares your net worth to your annual gross income, revealing how effectively you’re using your income to build wealth.
Formula: Net Worth-to-Income Ratio = Net Worth / Annual Gross Income

Interpretation: A high Net Worth-to-Income Ratio suggests that you effectively use your income to build wealth through saving or investing. Conversely, a low ratio indicates you have less accumulated wealth in comparison to your income, which could imply high levels of debt, low savings, or ineffective wealth accumulation strategies.
Benchmark: Net Worth-to-Income Ratio has no standard, as the ideal value can vary depending on age, lifestyle, and personal financial goals. Still, a good plan is to have a ratio of 1:1 by age 30, 2:1 by age 40, and 4:1 by age 60. These benchmarks are based on general financial planning guidelines and can vary depending on individual circumstances.
Example: If your total net worth is $200,000 and your annual gross income is $50,000, your Net-Worth-to-Income Ratio is $200,000 / $50,000 = 4. In this scenario, you’ve accumulated $4 for every dollar of annual income, suggesting the implementation of solid wealth-building strategies.
Key Impact: Monitoring your Net Worth-to-Income Ratio can provide insight into your financial health and the effectiveness of your wealth-building strategies. A higher ratio indicates financial stability and effective wealth accumulation, providing a solid foundation for future financial goals.
Key Limitation: While the Net Worth-to-Income Ratio can gauge financial health, it doesn’t consider income’s sustainability or fluctuations. For example, someone with a temporarily high income could show a skewed ratio, or someone facing a short-term income loss might appear less financially healthy than they really are.
Pro Tip: To improve your Net Worth-to-Income Ratio, consider implementing strategies like increasing your savings, investing wisely, and paying off debts. Investing wisely can include diversifying your portfolio, researching and understanding your investment choices, and staying updated with market trends. Also, regular financial planning and review can ensure you’re on track to meet your goals.
TLDR: Net Worth-to-Income Ratio gauges how effectively you’re building wealth in relation to your income. A high ratio suggests effective wealth accumulation. Aiming for a net worth that equals your yearly income by age 30 can be a helpful target, though benchmarks can vary by individual circumstances.
17. Rent-to-Income Ratio
Definition: Rent-to-Income Ratio compares your monthly or annual rent to your monthly or annual gross income. It calculates the proportion of your gross income spent on rent, helping landlords and lenders evaluate your ability to afford the cost of housing.
Formula: Rent-to-Income Ratio = Monthly Rent / Monthly Gross Income

Interpretation: A low Rent-to-Income Ratio indicates that a small proportion of your income is spent on rent, suggesting affordable housing expenses and greater financial flexibility. On the other hand, a high ratio shows that a significant part of your income goes toward rent, which could strain your budget, potentially affecting other financial responsibilities and aspirations.
Benchmark: A common standard for this ratio is 0.30 or 30%. If you spend more than 30% of your gross income on rent, you may be considered “rent-burdened.” This benchmark, however, can vary significantly based on geographic location, income level, and personal financial goals. For example, in areas with high living costs like New York City or San Francisco, many residents may find themselves exceeding this benchmark.
Example: If your monthly rent is $1,000 and your gross income is $3,500, your Rent-to-Income Ratio is $1,000 / $3,500 = 0.29 or 29%.
Key Impact: Your Rent-to-Income Ratio can significantly impact your ability to save money and invest for your future. If a high proportion of your income is going towards rent, it might limit your ability to pay off debt, save, or invest.
Key Limitation: Rent-to-Income Ratio provides insight into the affordability of housing costs but doesn’t account for other housing-related expenses such as utilities, home insurance, and property taxes. It also doesn’t consider your total living expenses or any personal debt you might have. Therefore, while an insightful measure of rent burden, the ratio may not accurately reflect your ability to afford rent.
Pro Tip: To improve your Rent-to-Income Ratio, consider implementing strategies like seeking more affordable housing, increasing your income, or getting a roommate to share rental expenses. Increasing your income might involve seeking additional certifications, taking up a side gig, or negotiating your current salary.
TLDR: Rent-to-Income Ratio showcases how much of your earnings are spent on housing. Ideally, this ratio should not exceed 30% to maintain financial flexibility. The lower the ratio, the higher your financial flexibility.
18. Retirement Savings-to-Annual-Income Ratio
Definition: Retirement Savings-to-Annual-Income Ratio measures the adequacy of your retirement savings relative to your annual gross income. It helps you understand whether your current retirement savings are sufficient to maintain your standard of living once you retire.
Formula: Retirement Savings-to-Annual-Income Ratio = Total Retirement Savings / Annual Gross Income
Interpretation: A high Retirement Savings-to-Annual-Income Ratio suggests that your retirement savings could support your lifestyle for a more extended period during your retirement years. Conversely, a lower ratio indicates that your savings may need to be revised to sustain your current lifestyle for an extended period after retirement.
Benchmark: The ideal ratio generally increases with age. For example, by age 30, you should have saved an amount equivalent to your annual gross income. By age 60, this should be about 6-9 times your yearly income.
Example: If your total retirement savings is $300,000 and your annual gross income is $50,000, your Retirement Savings-to-Annual-Income Ratio is $300,000 / $50,000 = 6.
Key Impact: Retirement Savings-to-Annual-Income Ratio helps you assess if you’re saving enough for a comfortable retirement. It can encourage disciplined and consistent saving and investing for retirement. If the ratio is low, consider saving more or adjusting your retirement lifestyle expectations.
Key Limitation: Retirement Savings-to-Annual-Income Ratio assumes a static view of retirement, where income needs don’t evolve significantly over time. In reality, retirees may experience varying expenses in different phases of retirement. For instance, they might have higher travel and leisure expenses in the early years of retirement and increased healthcare costs in the later stages. This ratio doesn’t accommodate the dynamic nature of retirement spending, potentially leading to miscalculations in required savings.
Pro Tip: To figure out how much retirement savings you need, create a realistic estimate of your annual expenses and divide that figure by 4%. For instance, if you estimate you’ll need $52,305 annually to live comfortably, you’ll need $1,307,625 in retirement savings. To improve your Retirement Savings-to-Annual-Income Ratio, consider strategies like increasing your savings rate, taking advantage of employer-matched retirement contributions, and investing wisely for long-term growth.
TLDR: Retirement Savings-to-Annual-Income Ratio helps evaluate your readiness for retirement. It’s beneficial to monitor this ratio throughout your career to ensure you’re on track for a comfortable retirement.
19. Retirement Savings-to-Net-Worth Ratio
Definition: Retirement Savings-to-Net-Worth Ratio compares your retirement savings to your net worth, providing a snapshot of what portion of your wealth you allocate to retirement savings.
Formula: Retirement Savings-to-Net-Worth Ratio = Total Retirement Savings / Net Worth

Interpretation: A high Retirement Savings-to-Net-Worth Ratio suggests a large proportion of your wealth is allocated toward retirement, which may reflect good long-term financial planning. Conversely, a low ratio indicates that a smaller portion of your wealth is dedicated to retirement, possibly because you have investments in liquid assets, real estate, or other ventures.
Benchmark: Retirement Savings-to-Net Worth Ratio has no universal standard as it depends on age, income, retirement goals, and lifestyle. However, this ratio should ideally increase as you approach retirement, reflecting a growth in the proportion of your wealth being set aside for retirement.
Example: If your total retirement savings amount to $200,000 and your total net worth is $500,000, your Retirement Savings-to-Net-Worth Ratio is $200,000 / $500,000 = 0.4 or 40%.
Key Impact: Understanding your Retirement Savings-to-Net-Worth Ratio can help you evaluate your retirement savings strategy and adjust it if needed. It can guide you in achieving a balanced asset allocation that is in line with your financial goals and retirement plans.
Key Limitation: Retirement Savings-to-Net-Worth Ratio doesn’t consider other factors influencing retirement preparedness like expected retirement lifestyle, healthcare costs, or your potential income from pensions or Social Security.
Pro Tip: To improve your Retirement Savings-to-Net-Worth Ratio, consider increasing your retirement savings contributions, diversifying your investment portfolio to enhance returns, and factoring in tax implications associated with different retirement accounts. It’s also wise to routinely review your financial plan to ensure alignment with your retirement goals.
TLDR: Retirement Savings-to-Net-Worth Ratio gauges how much of your wealth is set aside for retirement. The ideal ratio is personal and typically increases as one approaches retirement.
20. Savings-to-Income Ratio
Definition: Savings-to-Income Ratio reveals how much of your income is saved each month, providing a glimpse into your financial discipline and preparation for future needs.
Formula: Savings Ratio = Monthly Savings / Monthly Gross Income

Interpretation: A high Savings-to-Income Ratio suggests that you are saving a significant portion of your income, indicating good financial habits and a focus on building wealth. A low ratio means you’re not saving enough, which could be a sign of overspending or not prioritizing savings.
Benchmark: A common standard is the 20/30/50 rule, which suggests allocating 20% of your income to savings, 30% to discretionary spending, and 50% to essential expenses. Therefore, financial planners often recommend a Savings-to-Income Ratio of 20%. However, the 20/30/50 rule may not be ideal for everyone, and individual circumstances could necessitate adjustments.
Example: If you save $1,000 each month and your monthly gross income is $5,000, your Savings-to-Income Ratio is $1,000 / $5,000 = 0.2 or 20%.
Key Impact: Maintaining a high Savings-to-Income Ratio can significantly contribute to wealth accumulation and financial security. It helps ensure that you are financially prepared for emergencies and can achieve long-term goals such as buying a home or retiring comfortably.
Key Limitation: Savings-to-Income Ratio does not consider how effectively you use your savings, such as whether you invest them in ways that provide a good return. It also doesn’t consider your expenses, so a high savings rate may not be sustainable if you have high debt levels or other financial obligations.
Pro Tip: To improve your Savings-to-Income Ratio, consider automating your savings, budgeting carefully to reduce unnecessary expenses, and looking for ways to increase your income, such as through side jobs or investments.
TLDR: Savings-to-Income Ratio compares your savings to your income, helping you assess your savings habits. A higher ratio indicates better saving habits, with a common benchmark being at least 20% of your income
21. Savings-to-Net-Worth Ratio
Definition: Savings-to-Net-Worth Ratio quantifies how much of your overall net worth is readily available as savings, highlighting your financial flexibility and immediate accessibility to funds.
Formula: Savings-to-Net-Worth Ratio = Total Savings / Net Worth

Interpretation: A high Savings-to-Net-Worth Ratio indicates that a large portion of your wealth is held in savings, meaning you may have a significant safety net in case of emergencies or sudden expenses. A low ratio could suggest that your wealth is tied up in less liquid assets, such as real estate or investments.
Benchmark: The ideal Savings-to-Net-Worth Ratio varies based on age, risk tolerance, financial goals, and lifestyle. However, having some savings as part of your net worth provides a safety net for emergencies and unexpected expenses. How large this safety net should be relative to your net worth depends on the preceding factors. As general guidance:
- Younger individuals typically have a higher ratio as they’re still accumulating wealth in liquid assets.
- Older individuals often have a lower ratio because much of their wealth may be in long-term assets like property or investments.
Example: If your savings amount to $50,000 and your net worth is $200,000, your Savings-to-Net-Worth Ratio is $50,000 / $200,000 = 0.25 or 25%.
Key Impact: Savings-to-Net-Worth Ratio plays a pivotal role in financial planning. A high ratio, suggesting ample liquidity, might signal an opportunity to diversify investments for growth. Conversely, a low ratio indicates more assets are tied up, which might necessitate increasing immediate savings for unexpected costs. This ratio thus informs decisions on risk management, asset allocation, and retirement planning.
Key Limitation: Savings-to-Net-Worth Ratio doesn’t always capture an individual’s true liquidity. While cash is instantly accessible, assets like stocks or bonds can be quickly liquidated. Therefore, a low value doesn’t always imply limited access to funds.
Pro Tip: Balance is critical when managing your Savings-to-Net-Worth Ratio. While it’s essential to have a significant portion of your net worth in easily accessible, low-risk savings for emergencies, it’s equally important to consider the opportunity cost of not investing. Investments, while risky, typically yield higher returns over time, contributing to wealth accumulation. The higher the ratio, the more potential investment returns you forgo.
TLDR: Savings-to-Net-Worth Ratio reveals how liquid your wealth is. Paying attention to it can help you continuously optimize the balance between immediate liquidity and potential long-term growth.
22. Tax Burden Ratio
Definition: Tax Burden Ratio indicates the percentage of your income allocated to taxes, helping to gauge the fiscal impact of taxes on your financial health.
Formula: Tax Burden Ratio = Annual Taxes Paid / Annual Gross Income

Interpretation: A high Tax Burden Ratio indicates that a considerable portion of your income goes toward taxes, leaving less disposable income for other financial priorities. Conversely, a low ratio means a small amount of your income is spent on taxes, resulting in more funds for savings, expenses, and investments.
Benchmark: There’s no universally standard Tax Burden Ratio. Your ideal ratio will depend on your income level, tax deductions and credits, filing status, and jurisdiction. That said, you can use the average tax rate for your income bracket as a potential benchmark.
Example: If you paid $15,000 in taxes last year and your gross income was $75,000, your Tax Burden Ratio would be: $15,000 / $75,000 = 0.2 or 20%.
Key Impact: Tax Burden Ratio can help you understand the impact of taxes on your financial health. This information guides decisions around tax planning and provides insights into whether you’re taking full advantage of tax deductions and credits.
Key Limitation: Tax Burden Ratio doesn’t account for tax benefits that offset some of your tax obligations, such as tax credits or deductions. These benefits reduce your tax obligations, leading to more disposable income than this ratio might suggest.
Pro Tip: To improve your Tax Burden Ratio, consider working with a tax advisor to explore legal strategies to reduce your tax burden. Such strategies include maximizing tax-advantaged retirement contributions and claiming eligible tax deductions and credits.
TLDR: Tax Burden Ratio reveals how much of your income goes to taxes. Lowering this ratio can increase disposable income and potential savings.
Financial Ratios: Essential Pieces but Not the Entire Financial Health Jigsaw
While personal financial ratios offer valuable insights, it’s important to note that they are only a piece of the puzzle when it comes to understanding your overall financial health. Here are three main reasons why they aren’t the complete jigsaw puzzle.
- Selective Focus: Personal financial ratios only focus on specific aspects of your financial health. Think of it like using a flashlight in a dark room—you only see where you direct the beam, leaving a large portion of the room unilluminated. For instance, the debt-to-income ratio reveals your debt burden relative to your income. Still, it doesn’t provide information about your net worth or savings rate, which may paint a different picture of your overall debt burden.
- Lack of Time Sensitivity: Financial ratios often reflect a snapshot in time; hence, they may not consider temporal fluctuations or trends. For example, someone may temporarily have a high debt-to-income ratio due to a recent mortgage. This high ratio doesn’t necessarily signify financial instability, particularly if the person’s income is trending upwards and they’re consistently paying down their debt.
- Exclusion of Personal Variables: Personal financial ratios do not account for individual goals, risk tolerance, lifestyle choices, future plans, etc. For instance, someone with a high debt-to-income ratio due to student loans but pursuing a career in a typically high-earning field like medicine might have a brighter long-term financial outlook than the ratio suggests.
Therefore, it’s necessary to use multiple financial ratios that cut across different areas of your finances to gain a clear understanding of your financial situation. For example, you can use the:
- Capitalization Ratio and Debt-to-Asset Ratio to assess your ability to manage debt;
- Discretionary Income Ratio and Income Growth Rate to evaluate your ability to manage your income;
- Housing Expense Ratio and Income-to-Expense Ratio to assess your ability to manage your expenses;
- Cash Flow Ratio and Liquidity Ratio to determine your ability to meet immediate financial obligations;
- Emergency Fund Ratio and Savings-to-Income Ratio to assess your savings habits;
- Investment Ratio and Investment-to-Net-Worth Ratio to evaluate your investing habits;
- Financial Independence Ratio and Retirement Savings-to-Net-Worth Ratio to determine your preparedness for retirement; and
- Net Worth Growth Ratio and Net-Worth-to-Income Ratio to evaluate your net worth
In essence, while individual financial ratios can shine a light on specific aspects of your financial situation, using them collectively provides a comprehensive view of your financial status.
Financial Ratios: Trends Provide Better Insights
Calculating your financial ratios should not be a one-off activity, especially if you want better, actionable insights about your financial health. Track your financial ratios periodically, whether monthly, quarterly, biannually, or annually. Doing so allows you to identify positive and negative trends in your financial health, showing how your actions impact your financial well-being over time.
For example, let’s assume you notice that your Debt-to-Net-Worth Ratio has increased over the last few quarters from 0.2 to 0.5. That’s a negative trend suggesting that your financial risk is ballooning. Knowing this should prompt you to analyze your spending habits, take a closer look at your debt management, and consider implementing strategies to reduce your borrowing or accelerate debt repayment.
On the other hand, let’s say your Financial Independence Ratio has been gradually increasing from 0.4 to 0.7 over five years. That’s a positive trend indicating that you are effectively moving closer to your goal of financial independence. In this scenario, you should continue your current investment strategies or explore opportunities to further diversify and grow your passive income.
Besides providing actionable insights about your financial health, regularly reviewing your ratios promotes proactive financial management, allowing you to take action before minor issues become significant problems.
For instance, suppose you’re on the path to financial independence and have been tracking your Financial Independence Ratio monthly. Then, you notice a gradual decrease in this ratio from 0.75 to 0.65 over six months. Upon further investigation, you realize that one of your passive income sources, such as a dividend-paying stock, has been underperforming.
By identifying this trend early, you can review your investment portfolio and make informed decisions, such as diversifying your investments or reallocating funds to more promising opportunities. Paying attention to trends in your personal financial ratios helps you detect and address minor setbacks before they escalate, ensuring a smoother journey toward financial independence.
In a nutshell, regularly tracking and analyzing your financial ratios is essential. It empowers you to be proactive with your financial decisions, ensuring a path toward strong financial health.
The Bottom Line
Personal financial ratios are a powerful tool in your financial toolkit. They’re not scary or complicated. They’re like a financial health check-up you can do yourself without visiting a doctor. By checking these ratios regularly, you can ensure you’re on track to win the game of financial stability.
That said, while personal financial ratios provide a snapshot of your financial health and help you identify areas that need improvement, it’s crucial to understand that these ratios are not one-size-fits-all.
Why is this? Well, it’s because everyone’s financial situation is unique. Your income level, expenses, financial goals, lifestyle preferences, and risk tolerance differ from others’. These factors can greatly influence what an “ideal” financial ratio might look like for you.
For example, consider the savings ratio, which measures how much of your income you save. Suppose you’re a young professional at the start of your career. In that case, your Retirement Savings-to-Annual Income Ratio might be lower than someone retiring in a few years. This low ratio doesn’t necessarily mean you’re not doing well financially—it just reflects your current stage in life.
Similarly, someone passionate about building a business might have a high Debt-to-Income Ratio as they take on debt to invest in their business operations and growth. This high ratio doesn’t mean they’re managing their finances poorly. Instead, it reflects an intentional choice that aligns with their long-term entrepreneurship and business success goals.
Still, despite their limitations, personal financial ratios are extremely valuable as they provide a starting point and a framework for understanding your unique financial situation. They allow you to benchmark your financial health and progress over time.
They’re like signposts on a journey: they might not tell you exactly where to go, but they can tell you if you’re heading in the right direction. They help you spot potential issues early, plan for the future, and make informed decisions aligning with your financial goals.
Remember, the goal is not to hit a certain “standard” ratio but to find the best ratios for your situation and help you achieve your financial goals. This requires you to regularly review and adjust your financial ratios as your income, expenses, goals, and lifestyle evolve.
So, while personal financial ratios aren’t one-size-fits-all, they are flexible tools you can adapt to fit your unique financial situation and help guide you toward your financial goals.
About the Author
Abolade Akinfenwa is a seasoned finance professional with several certifications to his name. He’s a Financial Modeling & Valuation Analyst (FMVA)®, Capital Markets & Securities Analyst (CMSA)®, Commercial Banking & Credit Analyst (CBCA) ®, and Financial Planning & Wealth Management Professional (FPWM)™. With over three years of experience as a Financial Writer, Abolade specializes in helping finance professionals build authority and generate qualified leads for their services. Interested in collaborating or seeking insights? Connect with Abolade via LinkedIn or X, or email him.
Get newsletter updates from Alex
No spam. Just the highest quality ideas that will teach you how to build wealth via the stock market.
Download Link: Assessing Your Financial Health: Top 22 Personal Financial Ratios PDF download