
52-Week Range: Definition, Strategies, & Examples
The stock market can be unpredictable, but by understanding key metrics like the 52-week range, investors and traders can gain valuable insight into the performance of individual stocks. The 52-week range is an essential tool for assessing a stock’s historical volatility and potential for future gains or losses. In this article, we will delve into the significance of the 52-week range, explore diverse trading strategies centered around this metric, and outline methods for ascertaining whether a stock is oversold or overbought using the 52-week range.

Table of Content
- What Is the 52-Week High?
- What Is the 52-Week Low?
- 52-Week Range Trading Strategies
- How to Calculate Current Price Relative to 52-Week Range
- The Bottom Line
What Is the 52-Week High?
The 52-week high is the highest price a stock rose to during the past year. It signifies the peak value that a stock has achieved during the 52-week period. A stock trading close to its 52-week high might indicate that it is performing well and has strong upward momentum. [1] However, investors and traders should also consider other factors like overall market conditions and company performance before making investment and trading decisions based solely on this metric.
What Is the 52-Week Low?
The 52-week low is the lowest price a stock traded to during the past year. It represents the lowest point of a stock’s value during the 52-week period. A stock trading close to its 52-week low might signal that it is underperforming or facing challenges. [1] As with the 52-week high, investors and traders should consider other factors before making investment and trading decisions based on this metric alone.
52-Week Range Trading Strategies
The 52-week range offers valuable insights into stock price movements and can be used to develop various trading strategies. These strategies can help traders exploit price fluctuations and improve their trading performance. Here are three popular strategies based on the 52-week range:
Conversely, if a stock trades near its 52-week low and breaks below that level with significant volume, it may indicate a bearish trend. In this case, investors might consider shorting the stock or selling existing long positions.
It’s essential to consider other factors, such as overall market conditions, company performance, and technical indicators, to confirm the breakout’s strength and sustainability.
Mean Reversion Trading
Mean reversion trading is based on the idea that stock prices tend to revert to their mean or average price over time. Investors can look for stocks that have deviated significantly from their average price within the 52-week range and consider buying or selling based on the expectation of a return to the mean.
For example, suppose a stock has a 52-week high of $120 and a 52-week low of $80, with an average price of $100. If the stock currently trades at $130, which is significantly above its average price, a mean reversion trader might consider shorting it, expecting the price to revert to the mean.
Conversely, if the stock trades at $70, the trader might consider buying, anticipating a return to the average price.
Note that this strategy requires careful analysis of historical price data and other factors, such as market sentiment, economic conditions, and company performance, to identify the right entry and exit points for trades.
Support and Resistance Trading
The 52-week high and low can act as support and resistance levels for a stock. Support is a price level where a stock’s price tends to stop falling due to clusters of demand. In contrast, resistance is a price level where the price often stops rising due to clusters of supply. Investors can use these levels to identify potential entry and exit points for trades based on the stock’s historical price action.
For instance, imagine a stock with a 52-week high of $150 and a 52-week low of $100. Suppose the stock is currently trading at $105 and has consistently rebounded from the $100 level. In that case, investors might consider buying at $105, expecting the stock to bounce back and rise toward the resistance level at $150.
On the other hand, if the stock is trading at $145 and has consistently failed to break through the $150 resistance level, investors might consider selling or shorting the stock, anticipating a price decline back toward the support level at $100.
Support and resistance trading requires a thorough understanding of technical analysis, including chart patterns and indicators, to identify the most likely price movements and make informed trading decisions.
How to Calculate Current Price Relative to 52-Week Range
The current price relative to the 52-week range is an essential metric that helps investors understand a stock’s position within its historical trading range. This metric is particularly useful for determining whether a stock is overbought (closer to its 52-week high) or oversold (closer to its 52-week low). Calculating this percentage is simple using the following formula:
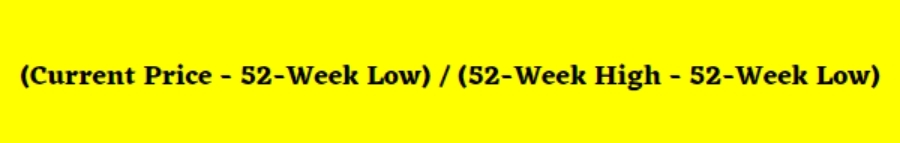
Here’s a step-by-step guide to using the formula:
Step 1: Identify the stock’s current price, 52-week high, and 52-week low.
For example, let’s say a stock has the following values:
- Current Price: $75
- 52-Week High: $100
- 52-Week Low: $50
Step 2: Subtract the 52-week low from the current price.
In our example: $75 (Current Price) – $50 (52-Week Low) = $25
Step 3: Subtract the 52-week low from the 52-week high.
In our example: $100 (52-Week High) – $50 (52-Week Low) = $50
Step 4: Divide the result from Step 2 by the result from Step 3.
In our example: $25 (Result from Step 2) / $50 (Result from Step 3) = 0.50 or 50%
In this example, the stock’s current price relative to its 52-week range is 50%. This means that the stock is trading in the middle of its 52-week range. A value closer to 100% would indicate that the stock is trading near its 52-week high, suggesting it may be overbought. Conversely, a value closer to 0% would indicate that the stock is trading near its 52-week low, suggesting that it may be oversold.
By using this formula, investors and traders can better understand a stock’s position within its historical range and make more informed decisions about buying or selling. As a rule of thumb, investors and traders start looking for buying opportunities when a stock is oversold and selling opportunities when it is overbought.
That said, it’s essential to remember that this metric should be used with other fundamental and technical analysis tools to understand a stock’s performance and potential future movements.
The Bottom Line
The 52-week range is a valuable metric for investors and traders looking to understand a stock’s historical performance and potential for future gains or losses. By incorporating the 52-week range into your analysis and trading strategies, you can make more informed decisions, identify potential opportunities, and manage your risk more effectively. Remember to always consider the broader market context and other factors when making investment decisions based on the 52-week range.
Sources
At ACDS Publishing, we hold ourselves to the highest standard of accuracy and credibility, ensuring that our readers receive only the most verifiable and substantiated information. To achieve this, we rely on a rigorous approach that involves sourcing information from reliable primary sources, including white papers, government data, original reporting, and expert interviews. By employing these methods, we strive to deliver factual and authoritative content that our readers can confidently trust.
- Steven Huddart, Mark Lang, Michelle H. Yetman (Management Science). “Volume and Price Patterns Around a Stock’s 52-Week Highs and Lows: Theory and Evidence.” Retrieved from https://pubsonline.informs.org/doi/10.1287/mnsc.1080.0920.
- Thomas J. George, Chuan-Yang Hwang (Wiley Online Library). “The 52-Week High and Momentum Investing.” Retrieved from https://onlinelibrary.wiley.com/doi/10.1111/j.1540-6261.2004.00695.x
Get newsletter updates from Alex
No spam. Just the highest quality ideas that will teach you how to build wealth via the stock market.
For example, consider a stock trading near its 52-week high of $100. If the stock’s price breaks above $100 with strong volume, it may signal the beginning of a bullish trend. Investors could enter a long position, expecting the stock price to continue rising.